It’s Radon Action Month. This is significant because much of Tennessee resides in a Class 1 radon zone, meaning the potential for elevated indoor radon levels is high.
In 1993, the EPA developed the Radon Zone Map to identify the potential risk of indoor radon across the country. This map relies on indoor radon measurements, geology, aerial radioactivity, soil parameters, and foundation types to establish three risk categories.
- Highest Risk – Zone 1: Counties with predicted average indoor radon levels greater than 4 pCi/L
- Medium Risk – Zone 2: Counties with predicted average indoor radon screening levels from 2-4 pCi/L
- Low Risk – Zone 3: Counties with predicted average indoor radon levels less than 2 pCi/L
The EPA recommends mitigating for radon if levels are above 4.0 pCi/L. However, there are some caveats. It is a common misconception that whatever result you get from your radon test, you are exposed to those levels 24/7, 365. In reality, radon levels fluctuate based on the weather, the season, and how you operate your home.
There is a reason January is National Radon Action Month. Radon tends to be highest in the winter when the ground surrounding your home is frozen and/or saturated and when the stack effect is most pronounced.
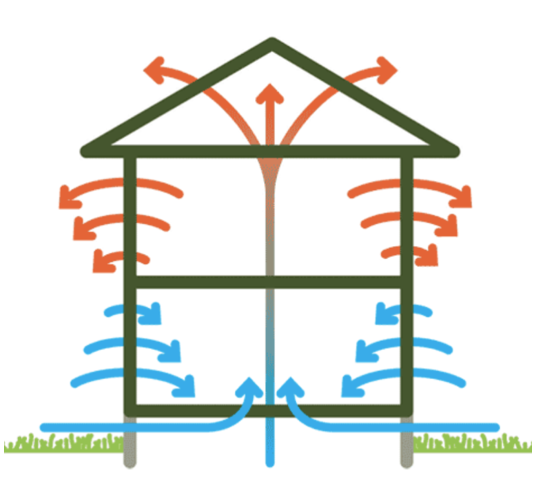
The stack effect, also known as the chimney effect (see image below), pulls cool air up from the base of the house to replace the warm air that rises up and eventually out through the top of the house and roof. Air that comes up from the base can cary radon with it. In the summer, the stack effect reverses direction, which usually leads to lower radon levels.

When you test for radon, it’s important to do a long-term test. E3 recommends a minimum of 10 days. In some cases, such as after a new construction project, a short-term (30-90 days) and a long-term (up to a year) test are recommended to get the full picture of a home’s unique radon exposure profile.
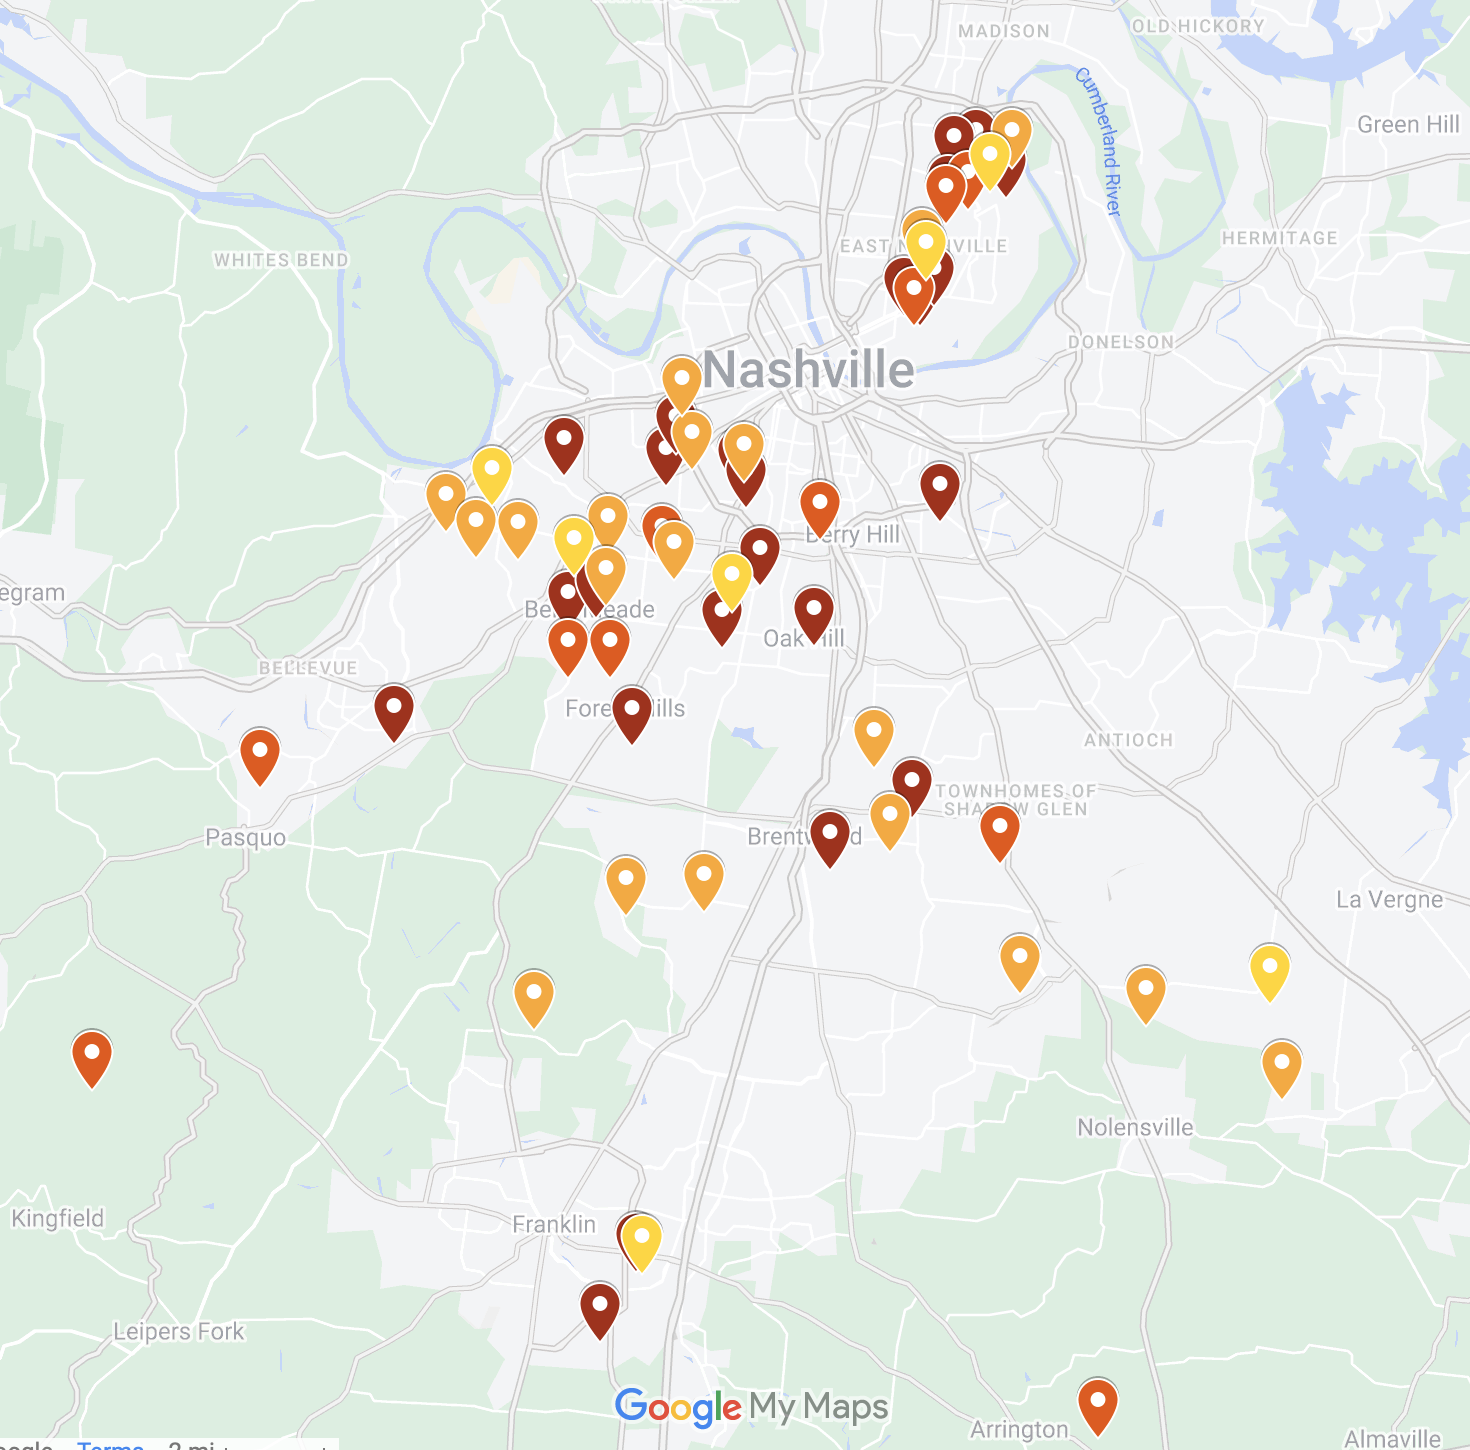
Over the last few years, E3 has mapped radon test results from our clients’ homes. Check out the map to see how common high radon levels are in our area. Note that some of these homes were tested before mitigation while some were tested after.
- RED – High: > 4.0 pCi/L
- RED/ORANGE – Medium High: 3-4 pCi/L
- ORANGE – Medium: 1-3 pCi/L
- YELLOW – Low: < 1.0 pCi/L

A radon mitigation system, along with a sealed crawlspace and proper ventilation, can help manage your long-term exposure to carcinogenic radon gas. E3 includes radon testing in every healthy home assessment so that we can ensure you are not at risk in the long term.


